
Liquidity Mirage or Market Fuel? Dissecting Global Liquidity Conditions in 2025
Is global liquidity rising again, and if so, is it real or just optical?
AVANTAS RESEARCH
7/5/20253 min read
Financial markets have continued to push higher in 2025, surprising many macro investors. Equities have posted double-digit gains, crypto has staged a resurgence, credit spreads remain tight, and the VIX hovers below historical averages, all while central banks insist they are still tightening and inflation remains above target.
This dissonance has raised one core question across hedge fund desks and CIO meetings alike:
Is global liquidity rising again, and if so, is it real or just optical?
Let’s dissect the multiple layers of liquidity driving markets today, spanning fiscal operations, central bank policies, private leverage, and passive inflows.
Why Fed Balance Sheet Shrinkage Doesn’t Tell the Whole Story:
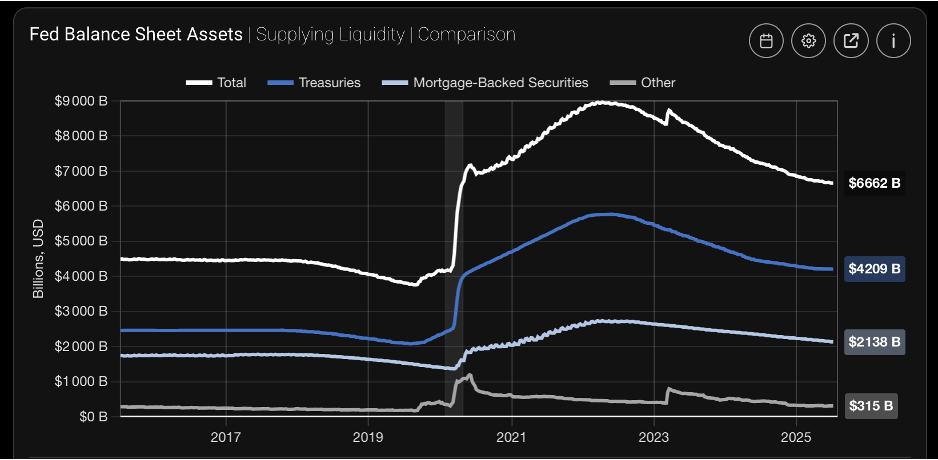
Source: streetstats.finance
While the Fed’s balance sheet has declined from its 2022 peak — now at $6.66 trillion — this contraction alone masks the underlying liquidity injections occurring via Treasury spending, BTFP usage, and drawdowns from the RRP and TGA.
The US: Treasury Liquidity Trumps Fed Tightening
While the Fed has kept the benchmark rate steady above 5% and continues QT (quantitative tightening), liquidity has entered through the backdoor:
Treasury General Account (TGA): The TGA has declined from ~$800bn to ~$450bn since March, effectively injecting hundreds of billions into the banking system as the Treasury spends more than it issues.
Reverse Repo (RRP) Facility: Money market fund usage of the Fed’s RRP facility has dropped significantly, freeing capital for short-duration credit and T-bill purchases.
Bank Term Funding Program (BTFP): Usage has quietly increased again, supporting banks’ balance sheets and risk-taking capacity.
Takeaway: The Fed is removing liquidity through QT, but the net liquidity (Fed balance sheet + RRP + TGA) has been rising, and markets are front-running it.
China: Easing Without Saying “Stimulus”
China’s policymakers have avoided headline-grabbing stimulus packages, but they’ve engineered a targeted re-expansion of credit:
· Relending facilities from the PBOC have quietly supported key sectors like semiconductors and EVs.
· Policy banks have expanded financing quotas.
Municipal debt swaps have indirectly freed up borrowing capacity for LGFVs.
Even in real estate, where regulatory tightening remains, banks have extended maturities and softened enforcement, allowing a “rolling over” of bad assets.
Impact: This credit easing supports industrial commodities (copper, steel, coal), boosts EM sentiment, and anchors China’s equity rebound in Q3.
Japan: Quiet Catalyst for Global Flows
While the BoJ tweaked yield curve control and signaled normalization, Japanese investors have not pulled back from global markets. Why?
Carry trade remains alive: With the yen weak and global yields high, Japanese investors continue buying US and European assets, often FX-hedged.
Pension funds and insurers are reallocating into global private equity and real estate at record pace.
This capital recycles liquidity into risk assets globally, from US tech to EM bonds, even if domestic Japanese monetary policy is tightening optically.
Synthetic Liquidity: Market Structure Effects
Even absent policy-driven liquidity, market microstructure itself is providing “pseudo-liquidity”:
· Dealer gamma positioning around short-dated options creates self-reinforcing flows (e.g., volatility suppression).
· Risk parity and vol-target funds have increased equity exposure as realized volatility fell, mechanically bidding markets higher.
· Passive flows (401k auto-enrollment, model portfolios) create non-economic demand that doesn’t respond to valuation or fundamentals.
Together, this creates a reflexive environment: higher prices drive more flows, which drive higher prices, until something breaks.
EM Central Banks: Reversing Ahead of the Fed
Some emerging markets, especially in LatAm, began easing as early as late 2023:
Brazil and Chile have aggressively cut rates, fueling local equity and bond rallies.
Even Turkey and India have provided selective liquidity to support investment and credit.
This has triggered regional asset booms, reinforcing global beta, and driving relative performance divergence between EM and DM.
Global asset allocators, underweight EM after years of underperformance, are now reallocating, further amplifying liquidity conditions in these regions.
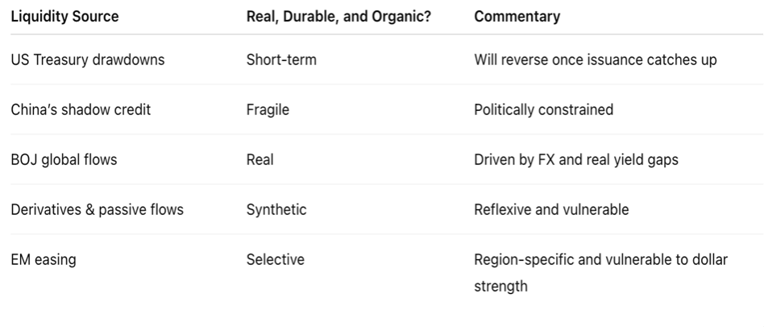
So, Is It Real or a Mirage?
Investment Implications
Tactical Risk-On Makes Sense… But with Hedges
o Long equity index with out-of-the-money puts.
o Upside skew in crypto via call spreads, funded by volatility decay.
EM Rotation May Continue
o Long India/Mexico equities.
o Long local-currency bonds in Brazil.
Duration Could Outperform Later
o When Treasury issuance ramps in Q4 and drains liquidity, duration may rally as risk assets wobble.
o Consider steepeners or TLT-type trades.
Watch the Plumbing
o Monitor the Fed’s TGA balance, RRP usage, and BTFP.
o Stay alert to any spike in credit spreads, repo stress, or volatility term structure, early warnings of liquidity reversal.
Conclusion: This is Not 2019, it is Trickier
Liquidity in 2025 is not coming from rate cuts or QE. It is coming from the interplay of fiscal injections, cross-border flows, synthetic leverage, and market reflexivity. The result is a buoyant market with fragile underpinnings.
Those who ignore the plumbing may celebrate rallies, only to get whipsawed by sudden shocks. Those who study the mechanics, and hedge smartly, may find this a golden age for tactical alpha.
Invest101.blog
Articles and resources for smart investing.
Contact
contact@invest101.blog
© 2025. All rights reserved.